AI claims / Consumer evidence
AI Ranking Quality Is Not Probability Reliability
Keep order-based discrimination, probability quality and actual trade economics on separate comparison lines.
A ranking asks a different question
A ranking metric examines whether higher scores tend to accompany one defined class more than another. It does not necessarily require scores to be well calibrated probabilities. Two score sets can preserve exactly the same ordering while making different numerical probability claims. Preserve the actual metric definition and population rather than labelling both accuracy. This distinction matters when a seller moves between ranked alerts, confidence percentages and profitability language without identifying which object was evaluated.
The scikit-learn scoring and calibration references distinguish these properties. The software documentation is not a recommendation to select a model from a single metric. Before comparing products, establish class definition, horizon, sample membership and whether the output is intended as a probability. A high rank on one chosen period does not automatically provide reliable event frequencies at every score level.
Same ordering, different declared magnitudes
A strictly increasing transformation can preserve order while changing distances from observed binary outcomes. That illustrates why a ranking figure alone cannot certify the numerical confidence printed beside an alert. Keep the transformation identity and its fitting history. If a vendor selected the transformation after viewing evaluation outcomes, that evaluation participated in development. Renaming the output confidence does not erase the exposure or demonstrate a better future forecast.
Neither measure is net account performance
Even a genuine probability model requires a separate decision rule, quantity, costs and execution convention before a monetary result is claimed. Directional labels can omit gain and loss sizes. A ranked shortlist may include ideas that were never actionable for a subscriber. Track those conditions rather than subtracting one assumed fee from an abstract ranking score. Independent model evaluation and actual account reconciliation need related but different evidence packets.
An inspectable comparison table
Publish the score meaning, ranking metric, probability metric, observation count, period and evidence class together. A missing measure should remain missing, not be inferred from the one supplied. Avoid a universal winner across explanations, research frameworks and executable feeds. A useful review might establish that a model ranks a specified synthetic population while leaving its calibrated event probabilities and customer economics entirely untested. That bounded conclusion is more informative than an unqualified AI accuracy percentage.
Completed fictional evidence case
The eight-row illustration retains the score ordering when scores 0.2/0.4/0.6/0.8 are transformed to 0.35/0.45/0.55/0.65. Both score sets give ROC area 0.75 on the same invented outcomes. Their Brier scores differ: 0.20 for the original and 0.2125 for the transformed set. Neither is a provider result, and the difference does not establish a universally preferable forecasting method. The declared transformation is fixed for this arithmetic illustration, not fitted from a private market sample. No costs, quantities or account returns are present to convert either metric into profit.
| Evidence object | Recorded value | Claim boundary |
|---|---|---|
| Original scores | ROC 0.75 / Brier 0.20 | Synthetic only |
| Transformed scores | ROC 0.75 / Brier 0.2125 | Same order, different magnitudes |
| Customer result | Not measured | Separate evidence |
Reproducible synthetic rows, not a model test
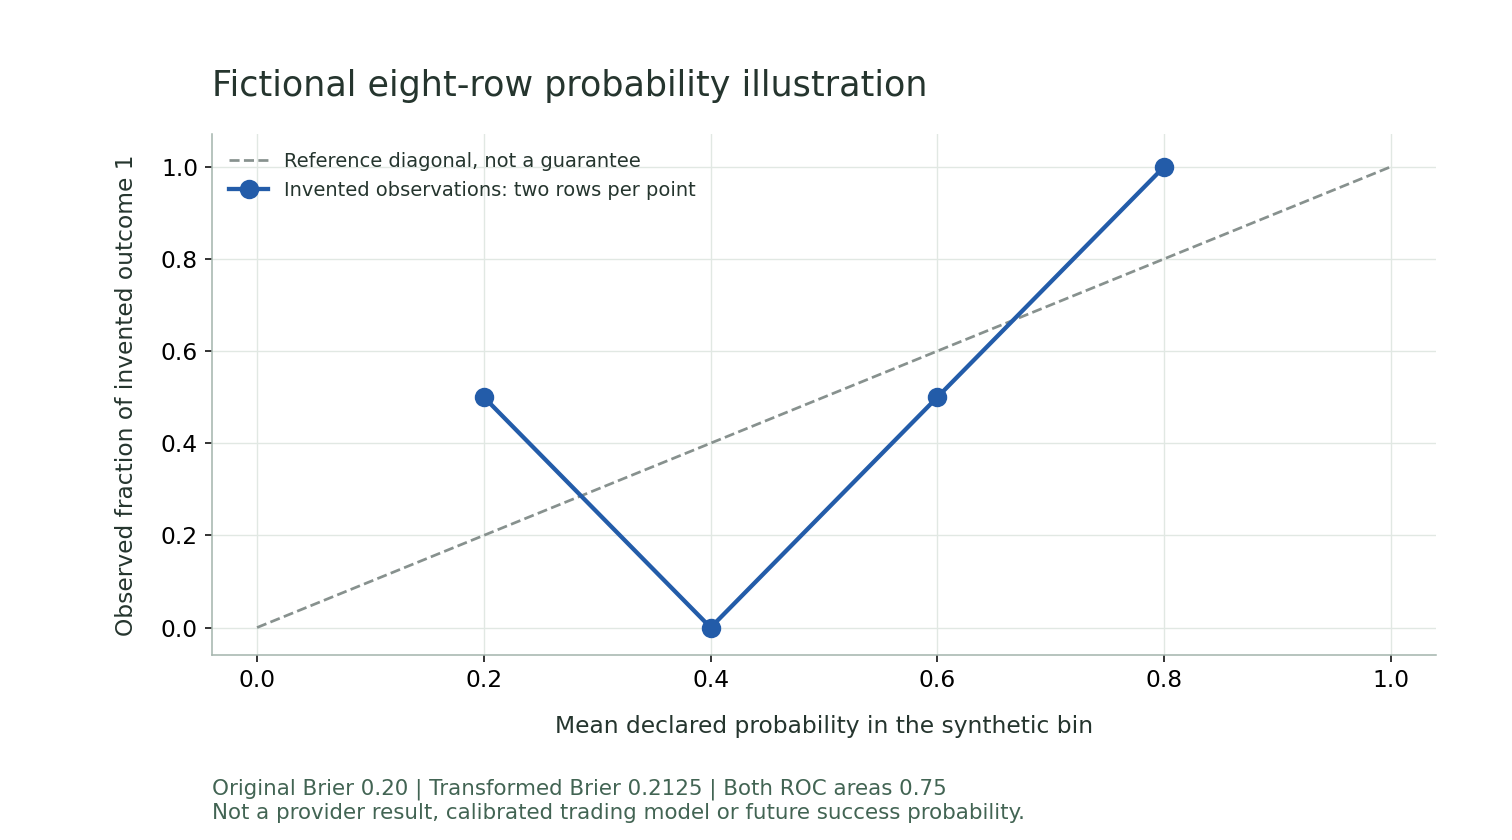
| Synthetic row | Original score | Transformed score | Invented outcome |
|---|---|---|---|
| toy-01 | 0.2 | 0.35 | 0 |
| toy-02 | 0.2 | 0.35 | 1 |
| toy-03 | 0.4 | 0.45 | 0 |
| toy-04 | 0.4 | 0.45 | 0 |
| toy-05 | 0.6 | 0.55 | 1 |
| toy-06 | 0.6 | 0.55 | 0 |
| toy-07 | 0.8 | 0.65 | 1 |
| toy-08 | 0.8 | 0.65 | 1 |
scikit-learn 1.5.2 computes original Brier 0.20, transformed Brier 0.2125 and ROC area 0.75 for both sets. Raw JSON keeps floating-point output and software versions. These metrics do not certify calibration or an investable edge.
Direct sources and reviewed scope
Public documents, not private vendor experiments. The worked cases are invented; source dates do not establish a model-validation engagement.