AI claims / Consumer evidence
AI Probability Calibration: Frequencies and Small Samples
Inspect a probability claim against its defined outcome and evaluation population, using an openly synthetic eight-row illustration.
What does the reported probability describe?
A numerical output needs an event definition, horizon and observation unit before it can be assessed as a probability. A seller's score may describe a rank, direction, price interval or another quantity. Ask which, and retain the model version with its output. The existing score-versus-probability chapter introduces that distinction; this chapter follows a specific probability claim into the outcome record rather than converting a confidence label into a customer success chance.
scikit-learn's calibration reference discusses how predicted probabilities can be compared with observed frequencies. It supplies a statistical vocabulary, not evidence that a commercial model followed the process. A plotted point should state its population and outcome endpoint. A rounded percentage without counts, eligible observations and missing-state handling is not enough to reproduce the comparison.
Keep the development and evaluation roles visible
If calibration choices are learned from a sample, that sample has a development role. Evaluating the resulting choices requires its own declared method and separation. Do not tune bins or transformations after seeing a favourable plot and then call the same plot untouched evidence. Preserve the fitted model, calibration component, sample membership and dates. A library function correctly calculating a toy metric demonstrates only that metric computation, not a private vendor's causal training history.
Why tiny bins do not establish future reliability
Two observations in a bin can change its frequency sharply when just one outcome changes. Dependent decisions, overlapping horizons and selective missing outcomes add other limitations. Report the counts instead of smoothing away the uncertainty. A point near the diagonal can still come from very little evidence, and a point away from it may be noisy. Neither alone proves a future chance, an investable edge or misconduct. The appropriate conclusion names the sampled object and what remains unverified.
Read the synthetic worksheet with its exact boundary
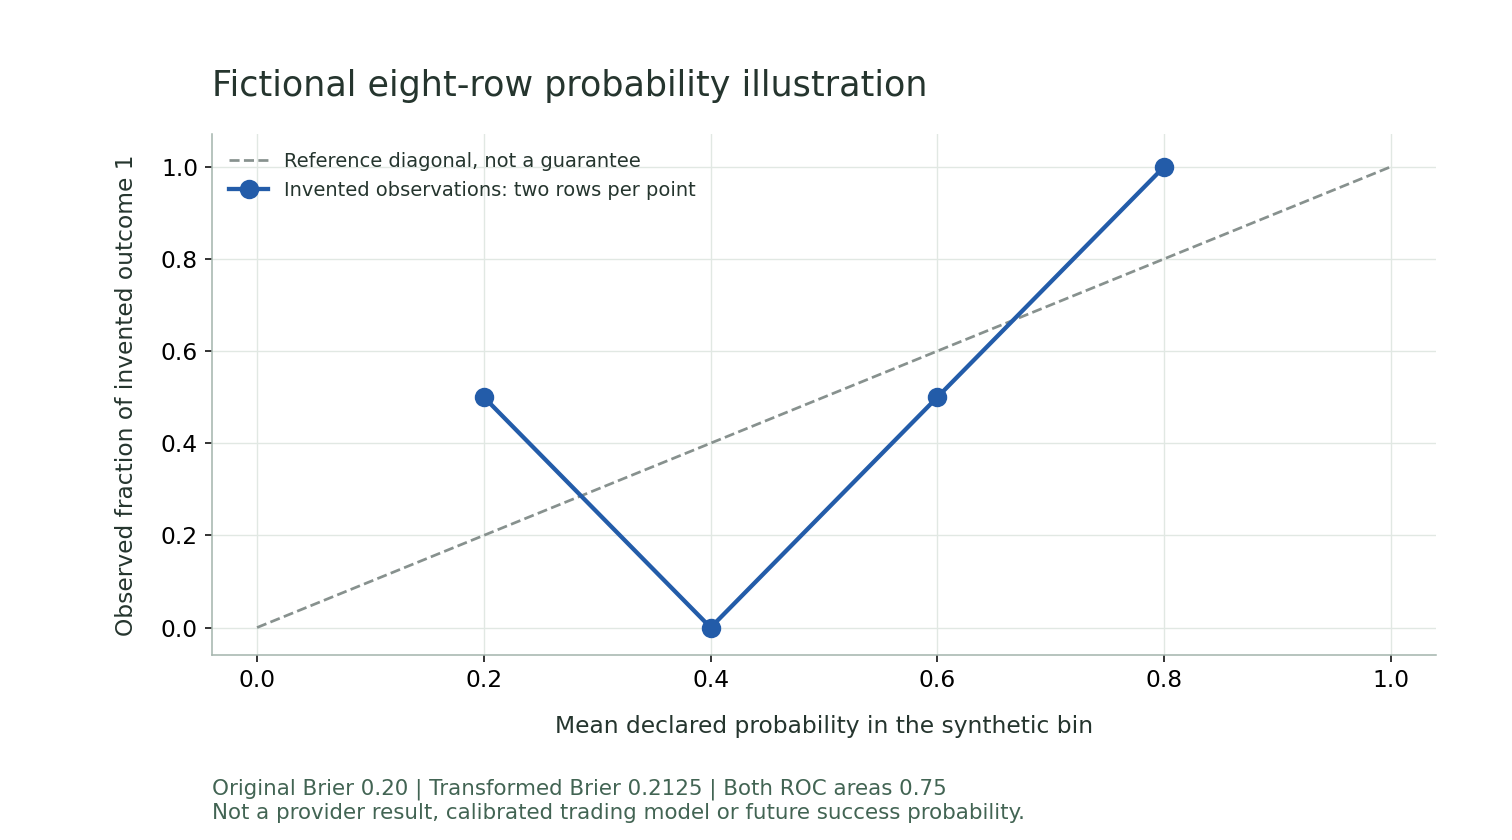
The downloadable illustration contains eight deliberately chosen binary outcomes, not market data. scikit-learn computes its Brier score and ranking metric under the recorded library version. Its four bins each have two rows. The graphic and table describe those rows only, with no confidence guarantee or provider comparison. Keep the raw CSV, definitions and software version together so that another reader can reproduce the educational arithmetic without mistaking it for a strategy-validation sample.
Completed fictional evidence case
Synthetic scores are 0.2, 0.2, 0.4, 0.4, 0.6, 0.6, 0.8 and 0.8; outcomes are 0, 1, 0, 0, 1, 0, 1 and 1. Bin frequencies are 0.5, 0, 0.5 and 1 with two observations each. Brier score is 0.20 and the ROC ranking area is 0.75 for these invented rows. A constant 0.5 predictor has Brier 0.25 on the same rows. This comparison does not certify calibration, estimate a future win rate or measure returns. A different sample could give a different result, and no actual provider is assigned either score.
| Evidence object | Recorded value | Claim boundary |
|---|---|---|
| Claimed probability | Defined event and horizon | Not supplied by a label |
| Each toy bin | 2 invented rows | Very small population |
| Toy Brier score | 0.20 | Not a trading result |
| Toy ROC area | 0.75 | Ranking, not probability reliability |
Reproducible synthetic rows, not a model test
| Synthetic row | Original score | Transformed score | Invented outcome |
|---|---|---|---|
| toy-01 | 0.2 | 0.35 | 0 |
| toy-02 | 0.2 | 0.35 | 1 |
| toy-03 | 0.4 | 0.45 | 0 |
| toy-04 | 0.4 | 0.45 | 0 |
| toy-05 | 0.6 | 0.55 | 1 |
| toy-06 | 0.6 | 0.55 | 0 |
| toy-07 | 0.8 | 0.65 | 1 |
| toy-08 | 0.8 | 0.65 | 1 |
scikit-learn 1.5.2 computes original Brier 0.20, transformed Brier 0.2125 and ROC area 0.75 for both sets. Raw JSON keeps floating-point output and software versions. These metrics do not certify calibration or an investable edge.
Direct sources and reviewed scope
Public documents, not private vendor experiments. The worked cases are invented; source dates do not establish a model-validation engagement.