An AI Trading Score Is Not Automatically a Win Probability
Inspect labels, calibration, thresholds and decision economics before turning a model score into confidence or account size.
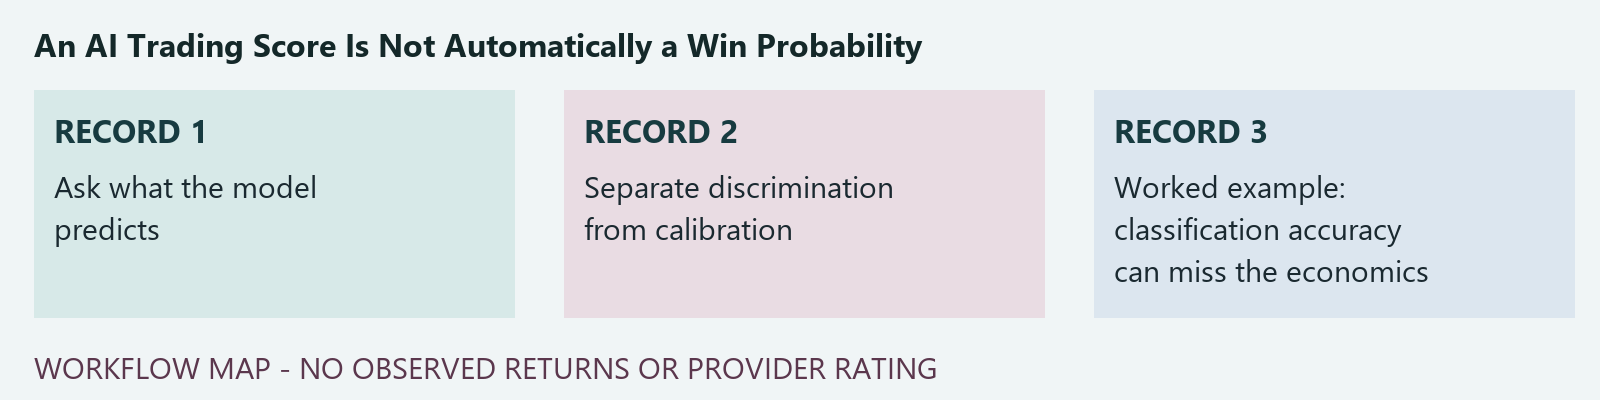
Ask what the model predicts
Identify the label, horizon, eligible population and information available at prediction time. A classifier estimating a later directional label is not necessarily estimating profitable execution after costs. A model can rank cases without returning a meaningful probability. Record whether the displayed value is a raw score, transformed score, class prediction or explicitly calibrated estimate. A product described as AI still needs these definitions. Do not infer the label or interpret an impressive-looking confidence percentage from the marketing name alone.
Separate discrimination from calibration
A ranking metric describes how predictions order a declared outcome, while calibration concerns how numerical probabilities relate to observed frequencies under an appropriate sample. The scikit-learn calibration documentation defines this distinction; it does not independently validate a paid trading product. Ask for the calibration population, prediction archive, evaluation window and grouping rules. A letter grade or percentage display can be useful presentation without being a probability. Its claimed interpretation should be supported by the relevant record rather than assumed.
Worked example: classification accuracy can miss the economics
Invent a model producing eight correct small-direction calls and two incorrect calls. Suppose the fictional successful outcomes earn one unit each and the incorrect outcomes lose six each. Before costs, total outcome is eight minus twelve, or negative four, despite 80% directional correctness under the invented labels. This does not describe a real AI service or estimate expected performance. It shows why an accuracy claim needs its outcome definition and payoff distribution before being used as a value judgment.
Inspect training and selection access
Preserve data availability, candidate search, tuning decisions and evaluation access. A later test inspected repeatedly becomes part of model selection. Temporal folds still need checks for overlapping labels, grouped observations, revised inputs and fitted transformations. Cross-validation tools can implement a split without resolving those design questions. Ask whether model updates changed the label, threshold or market population. An old validation chart cannot automatically support a newly retrained model merely because the same product name remains on the dashboard.
Keep probability separate from position sizing
Even a suitably validated probability does not by itself identify an account allocation. Payoffs, dependence, costs, funding constraints and personal suitability remain different questions. Do not map a provider score directly onto a universal risk percentage or treat a confident prediction as a hard loss bound. CFTC AI customer guidance provides fraud and risk context, not an endorsement of an algorithm. A statement that a service is systematic should not be stretched into a claim that it uses a particular AI architecture or has calibrated probabilities.
Demand a prediction-to-outcome trail
A useful review links dated predictions to a complete eligible population, stated outcome rules and independent evaluation records. Keep model behaviour, execution and subscriber results separate. Missing architecture disclosure can limit inspection without proving fraud; missing performance evidence limits the performance claim itself. This chapter presents a model-literacy workflow and invented arithmetic, not a paid-product test. The decision worksheet helps a reader determine what a displayed score actually means and which evidence would be required before assigning it a stronger interpretation.
Decision record
| Question | Record to retain | Decision boundary |
|---|---|---|
| Prediction | Label, horizon and eligible population | Direction is not necessarily net profitable execution |
| Score | Output type and claimed interpretation | A display percentage is not automatically calibrated |
| Validation | Selection history and later prediction archive | Repeated test access changes the evidence status |
| Sizing | Separate payoff and account constraints | Confidence does not determine a universal allocation |
Blank working record
The worksheet contains column headings only. Enter your own dated observations, keep absent evidence marked unknown, and do not treat the file as certification.
 Download worksheet (CSV)
Primary references
- scikit-learn: probability calibration
- scikit-learn: cross-validation and temporal data
- CFTC: AI trading claims
These documents support mechanisms and source definitions, not a tested trading result or a recommendation. Accessed 9 October 2026. The decision workflow and invented examples above are editorial exercises.
Keep reading
Publication methodology | Working glossary | Source and correction policy
The score introduction now has a reproducible follow-up
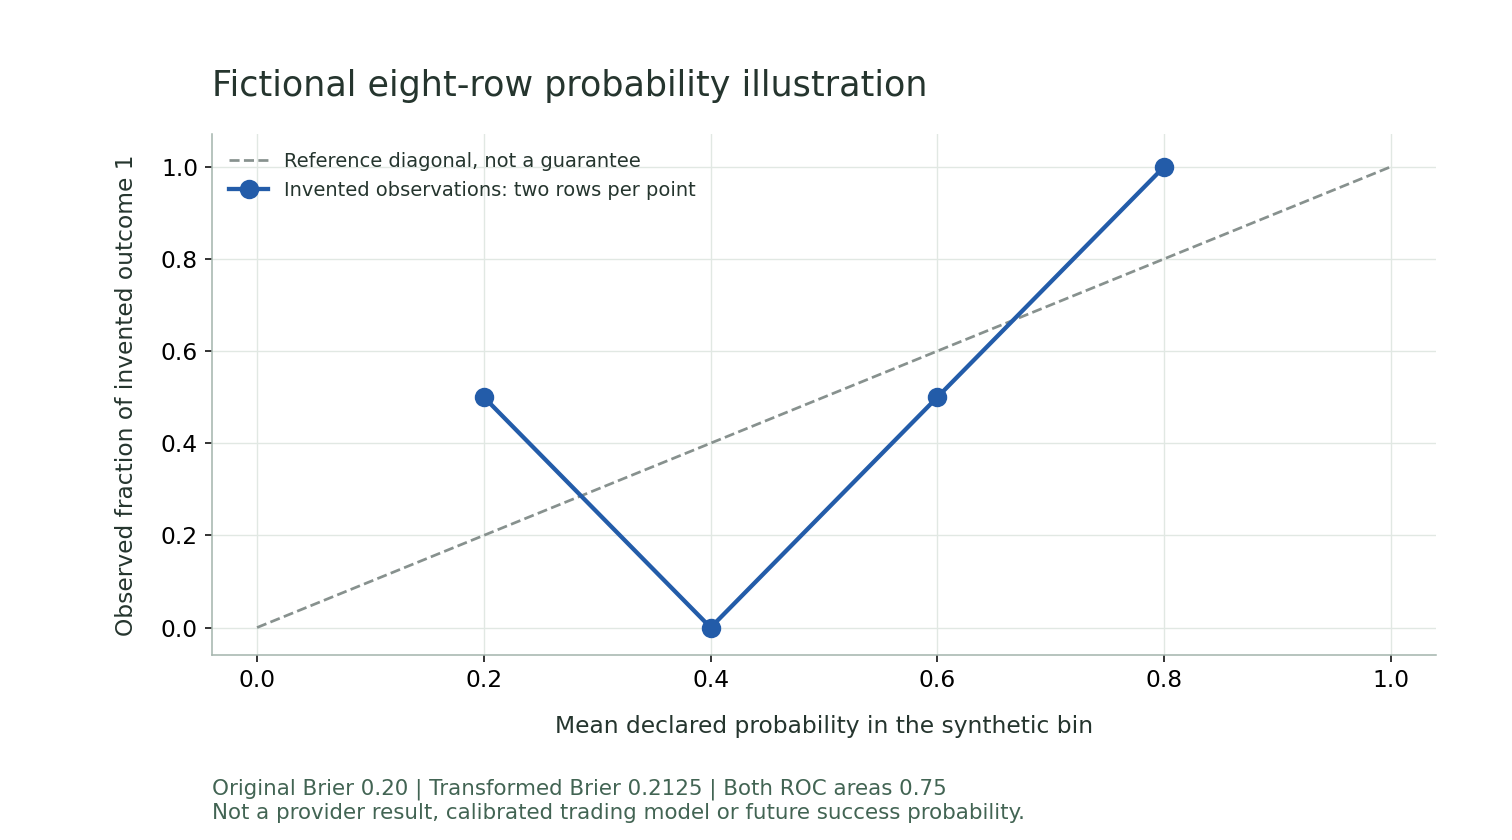
The original confidence-versus-probability example and its blank record remain. The new calibration chapter adds eight openly synthetic observations, a downloadable filled CSV and a graphic computed with a disclosed library version. It shows why a number's meaning, observed frequency and ranking metric are different fields, not a real model-performance claim.
A monotonic transformation of those toy scores preserves ROC area while changing Brier error. The limited result does not demonstrate future reliability, adequate sample size or monetary value. Use it to formulate a precise seller question, then request the original event definition, complete population and evaluation protocol. A documented A-D grade does not automatically inherit probability semantics from this illustration.
Reproducible synthetic rows, not a model test
| Synthetic row | Original score | Transformed score | Invented outcome |
|---|---|---|---|
| toy-01 | 0.2 | 0.35 | 0 |
| toy-02 | 0.2 | 0.35 | 1 |
| toy-03 | 0.4 | 0.45 | 0 |
| toy-04 | 0.4 | 0.45 | 0 |
| toy-05 | 0.6 | 0.55 | 1 |
| toy-06 | 0.6 | 0.55 | 0 |
| toy-07 | 0.8 | 0.65 | 1 |
| toy-08 | 0.8 | 0.65 | 1 |
scikit-learn 1.5.2 computes original Brier 0.20, transformed Brier 0.2125 and ROC area 0.75 for both sets. Raw JSON keeps floating-point output and software versions. These metrics do not certify calibration or an investable edge.